hwahl/iStock via Getty Images
As the saying goes, “rotation is the lifeblood of a bull market”.
Small and mid-caps are now trading tight, and setting up for breakouts higher. If these breakouts materialise, then that would likely mean broadening market breadth, a constructive development.
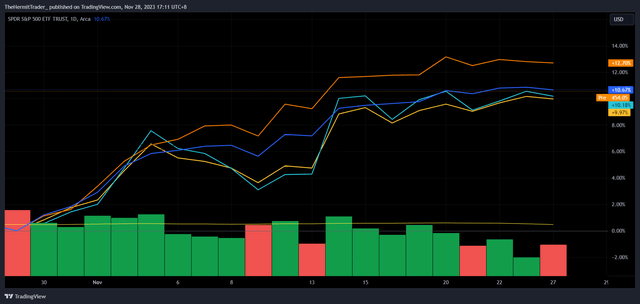
Since the recent market bottom on 27 October, the S&P 500 (SPY) and Nasdaq 100 (QQQ) have outperformed small and mid-caps.
The performances since 27 October have been as follows. I used the Russell 2000 (IWM) and SPDR S&P MIDCAP 400 ETF Trust (MDY) as proxies for small caps and mid-caps respectively.
SPY: + 10.7%.
QQQ: + 12.7%.
IWM: + 10.2%.
MDY: + 9.9%.
Performance comparison chart: SPY (in purple), QQQ (in orange), IWM (in teal), MDY (in yellow)
TradingView
While both the SPY and QQQ are about -5% from fresh all-time highs, IWM and MDY are lagging severely. They are -27% and -13% away from their all-time highs, respectively.
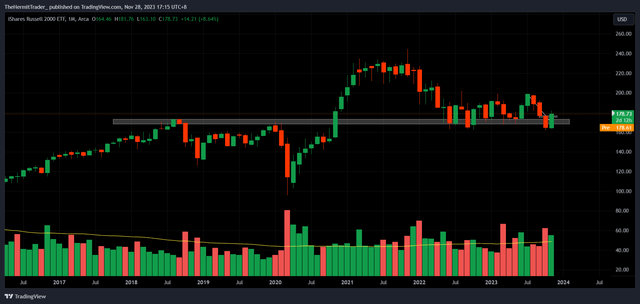
Below, we may see the long term monthly chart of IWM. IWM is trading at levels seen in 2018, while the SPY and QQQ are nowhere close to theirs.
IWM is currently testing long term support levels, and is finding buying demand at this area so far.
Monthly Chart: IWM
TradingView
When we drill into the daily chart of IWM, we may observe that price has formed a tight trading range in recent days, while surfing the 10 day moving average higher.
It looks likely that IWM breaks out higher from this tight flag, and embarks on its next burst higher. We may also observe that IWM broke above downtrend resistance on 14 November, which is a constructive development.


