
Machine learning is a type of computer algorithm that helps machines learn without the need for explicit programming.
Today, we see applications of machine learning everywhere — in navigation systems, movie streaming platforms, and ecommerce applications.
In fact, from the time you wake up in the morning until you go to bed, you are likely to have interacted with dozens of machine learning models without even realizing it.
The machine learning industry is projected to grow by over 36% between 2024 to 2030.
Given that almost every large organization is actively investing in AI, you only stand to benefit from honing your machine learning skills.
Whether you are a data science enthusiast, developer, or an everyday person who wants to improve your knowledge in the subject, here are 5 commonly-used machine learning models you should know about:
1. Linear Regression
Linear regression is the most popular machine learning model used to perform quantitative tasks.
This algorithm is used to predict a continuous outcome (y) using one or more independent variables (X).
For example, you would use linear regression if given the task to predict house prices based on their size.
In this case, the house size is your independent variable X which will be used to predict the house price, which is the independent variable.
This is done by fitting a linear equation that models the relationship between X and y, represented by y=mX+c.
Here is a diagram representing a linear regression that models the relationship between house price and size:
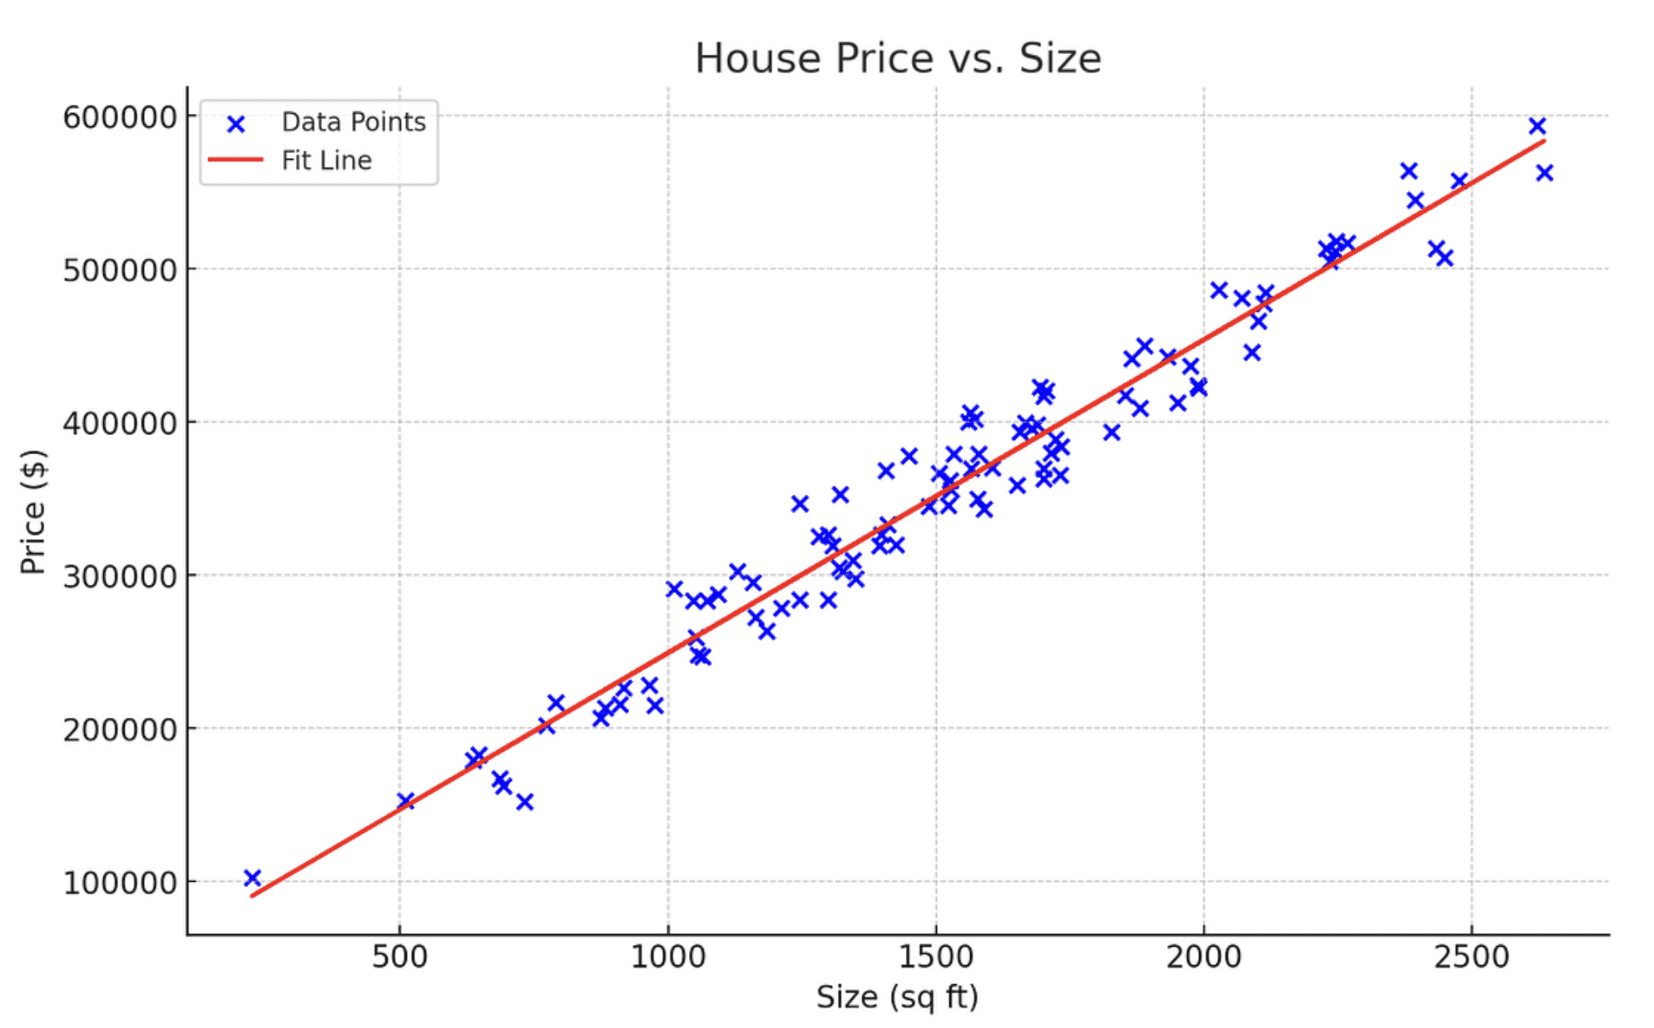 Image by author
Learning Resource
To learn more about the intuition behind linear regression and how it works mathematically, I recommend watching Krish Naik’s YouTube tutorial on the subject.
2. Logistic Regression
Logistic regression is a classification model used to predict a discrete outcome given one or more independent variables.
For example, given the number of negative keywords in a sentence, logistic regression can be used to predict whether a given message should be classified as legitimate or spam.
Here is a chart displaying how logistic regression works:
 Image by author
Notice that unlike linear regression which represents a straight line, logistic regression is modeled as an S-shape curve.
As indicated in the curve above, as the number of negative keywords increases, so does the probability of the message being classified as spam.
The x-axis of this curve represents the number of negative keywords, and the y-axis shows the probability of the email being spam.
Typically, in logistic regression, a probability of 0.5 or greater indicates a positive outcome — in this context, it means that the message is spam.
Conversely, a probability of less than 0.5 indicates a negative outcome, meaning the message is not spam.
Learning Resource
If you’d like to learn more about logistic regression, StatQuest’s logistic regression tutorial is a great place to start.
3. Decision Trees
Decision trees are a popular machine learning model used for both classification and regression tasks.
They work by breaking the dataset down based on its features, creating a tree-like structure to model this data.
In simple terms, decision trees allow us to continuously split data based on specific parameters until a final decision is made.
Here is an example of a simple decision tree determining whether a person should eat ice-cream on a given day:
 Image by author
The tree starts with the weather, identifying whether it is conducive to eat ice-cream.
If the weather is warm, then you proceed to the next node, health. Otherwise, the decision is no and there are no more splits.
At the next node, if the person is healthy, they can eat the ice-cream. Otherwise, they should refrain from doing so.
Notice how the data splits on each node in the decision tree, breaking the classification process down into simple, manageable questions.
You can draw a similar decision tree for regression tasks with a quantitative outcome, and the intuition behind the process would remain the same.
Learning Resource
To learn more about decision trees, I suggest watching StatsQuest’s video tutorial on the topic.
4. Random Forests
The random forest model combines the predictions made by multiple decision trees and returns a single output.
Intuitively, this model should perform better than a single decision tree because it leverages the capabilities of multiple predictive models.
This is done with the help of a technique known as bagging, or bootstrap aggregation.
Here’s how bagging works:
A statistical technique called bootstrap is used to sample the dataset multiple times with replacement.
Then, a decision tree is trained on each sample dataset. The output of all the trees are finally combined to render a single prediction.
In the case of a regression problem, the final output is generated by averaging the predictions made by each decision tree. For classification problems, a majority class prediction is made.
Learning ResourceYou can watch Krish Naik’s tutorial on random forests to learn more about the theory and intuition behind the model.
5. K-Means Clustering
So far, all the machine learning models we’ve discussed fall under the umbrella of a method called supervised learning.
Supervised learning is a technique that uses a labeled dataset to train algorithms to predict an outcome.
In contrast, unsupervised learning is a technique that doesn’t deal with labeled data. Instead, it identifies patterns in data without being trained on what specific outcomes to look for.
K-Means clustering is an unsupervised learning model that essentially ingests unlabeled data and assigns each data point to a cluster.
The observations belong to the cluster with the nearest mean.
Here is a visual representation of the K-Means clustering model:
 Image by author
Notice how the algorithm has grouped each data point into three distinct clusters, each represented by a different color. These clusters are grouped based on their proximity to the centroid, denoted by a red X-mark.
Simply put, all data points within Cluster 1 share similar characteristics, which is why they are grouped together. The same principle applies to Clusters 2 and 3.
When building a K-Means clustering model, you must explicitly specify the number of clusters you’d like to generate.
This can be accomplished using a technique called the elbow method, which simply plots the model’s error scores with various cluster values on a line chart. Then, you choose the inflection point of the curve, or its “elbow” as the optimal number of clusters.
Here is a visual representation of the elbow method:
 Image by author
Notice that the inflection point on this curve is at the 3-cluster mark, which means that the optimal number of clusters for this algorithm is 3.
Learning Resource
If you’d like to learn more about the topic, StatQuest has an8-minute video that clearly explains the workings behind K-Means clustering.
Next Steps
The machine learning algorithms explained in this article are commonly used in industry-wide applications such as forecasting, spam detection, loan approval, and customer segmentation.
If you’ve managed to follow along till here, congratulations! You now have a solid grasp of the most widely used predictive algorithms, and have taken the first step to venture into the field of machine learning.
But the journey doesn’t end here.
To cement your understanding of machine learning models and be able to apply them to real-world applications, I suggest learning a programming language like Python or R.
Freecodecamp’s Python for Beginners coursecourse is a great starting point. If you find yourself stuck in your programming journey, I have a YouTube video that explains how to learn to code from scratch.
Once you learn to code, you will be able to implement these models in practice using libraries like Scikit-Learn and Keras.
To enhance your data science and machine learning skills, I suggest creating a tailored learning path for yourself using generative AI models like ChatGPT. Here is a more detailed roadmap to help you get started with utilizing ChatGPT to learn data science.
Natassha Selvaraj is a self-taught data scientist with a passion for writing. Natassha writes on everything data science-related, a true master of all data topics. You can connect with her on LinkedIn or check out her YouTube channel.


